来源
软件架构图是一种非常好的表达方式,可以用它们来表达你将如何构建一个软件系统(预先设计)或者现有的软件系统是如何工作的(回顾文档、知识分享和学习)。
然而,你所看到的大多数软件架构图很可能只是由混乱的框和线组成。敏捷软件开发宣言的一个副作用就是让很多团队停止或缩减了他们的图表和文档工作,包括使用UML。
现在,这些团队倾向于依靠他们在白板上绘制的临时图表,或者使用通用的图表工具(如微软的Visio)。Ionut Balosin 在去年写了一篇叫作“软件架构图的艺术”的文章,他在文章中描述了一些常见问题,这些问题与不可理解的符号和不明确的语义有关。

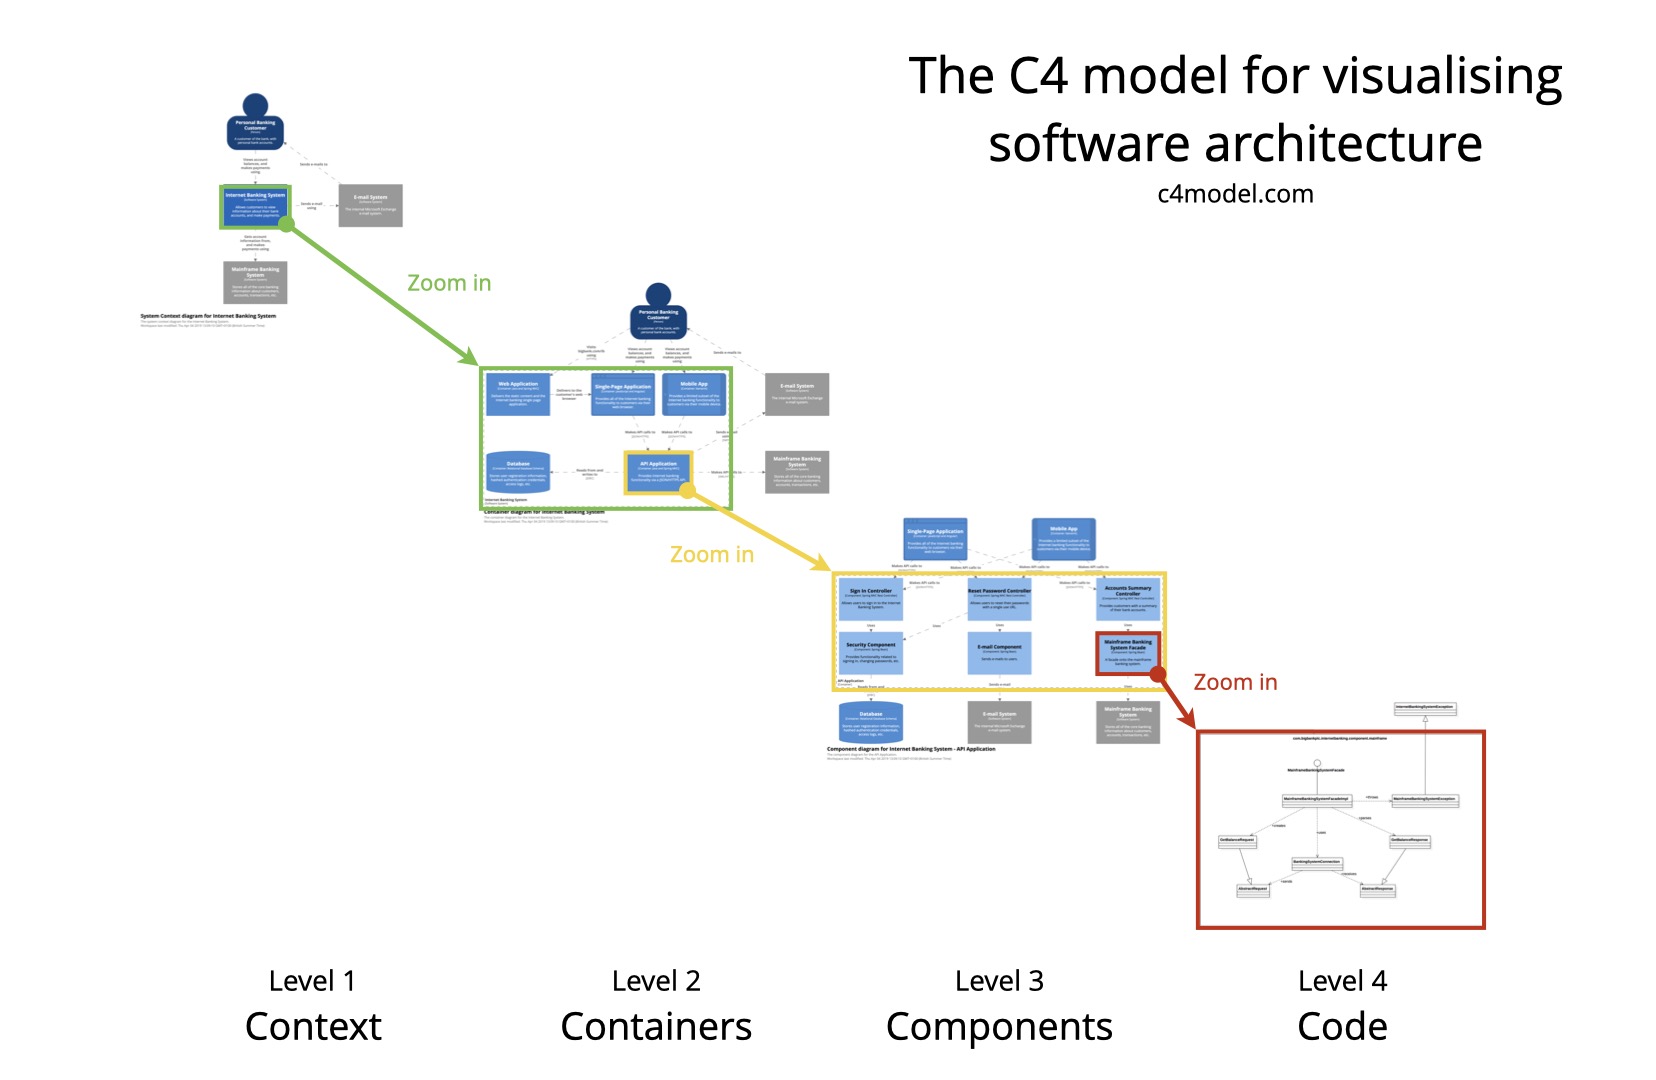
创建C4模型是为了帮助软件开发团队在前期设计会议期间以及回顾性地记录现有代码库时描述和交流软件体系结构。这是一种以各种细节级别创建代码映射的方法,就像使用Google Maps之类的工具来放大或缩小您感兴趣的区域一样。
The C4 model was created as a way to help software development teams describe and communicate software architecture, both during up-front design sessions and when retrospectively documenting an existing codebase. It’s a way to create maps of your code, at various levels of detail, in the same way you would use something like Google Maps to zoom in and out of an area you are interested in.

尽管C4模型主要针对软件架构师和开发人员,但它为软件开发团队提供了一种有效且有效地交流其软件体系结构的方法,该方法可以进行不同级别的详细说明,在进行前期设计或追溯时向不同类型的受众讲述不同的故事。记录现有代码库。
Although primarily aimed at software architects and developers, the C4 model provides a way for software development teams to efficiently and effectively communicate their software architecture, at different levels of detail, telling different stories to different types of audience, when doing up front design or retrospectively documenting an existing codebase.

C4模型是一种“抽象抽象”的软件体系结构图方法,它基于反映软件架构师和开发人员如何思考和构建软件的抽象。少量的抽象和图表类型使C4模型易于学习和使用。
抽象
C4 模型使用容器(应用程序、数据存储、微服务等)、组件和代码来描述一个软件系统的静态结构。它还考虑到使用软件系统的人。
The C4 model considers the static structures of a software system in terms of containers, components and code. And people use the software systems that we build.
Person
一个人代表您的软件系统的人类用户之一(例如,参与者,角色,角色等)
A person represents one of the human users of your software system (e.g. actors, roles, personas, etc).
Software System
软件系统是最高级别的抽象,它描述的东西可以为用户带来价值,无论他们是不是人类。这包括您正在建模的软件系统,以及该软件系统所依赖的其他软件系统(反之亦然)。在许多情况下,一个软件系统是由一个软件开发团队“拥有”的。
A software system is the highest level of abstraction and describes something that delivers value to its users, whether they are human or not. This includes the software system you are modelling, and the other software systems upon which your software system depends (or vice versa). In many cases, a software system is “owned by” a single software development team.
Container
在C4模型中,容器代表应用程序或数据存储。为了使整个软件系统正常工作,必须运行一个容器。
Not Docker! In the C4 model, a container represents an application or a data store. A container is something that needs to be running in order for the overall software system to work.
容器例如:
- Apache Tomcat
- Angular
- MySQL
- Shell
容器本质上是在其中执行一些代码或存储一些数据的上下文或边界。每个容器都是一个可单独部署/运行的事物或运行时环境,通常(但并非总是)在其自己的进程空间中运行。因此,容器之间的通信通常采用进程间通信的形式。
A container is essentially a context or boundary inside which some code is executed or some data is stored. And each container is a separately deployable/runnable thing or runtime environment, typically (but not always) running in its own process space. Because of this, communication between containers typically takes the form of an inter-process communication.
Component
组件是封装在定义良好的接口后面的一组相关功能。
The word “component” is a hugely overloaded term in the software development industry, but in this context a component is a grouping of related functionality encapsulated behind a well-defined interface.
在C4模型中,组件不是可单独部署的单元。
An important point to note here is that all components inside a container typically execute in the same process space. In the C4 model, components are not separately deployable units.
核心图(Core diagrams)
然后,通过创建Context,Container,Component和(可选)代码(例如UML类)图的集合来可视化此抽象层次结构。这就是C4模型的名称。
Visualising this hierarchy of abstractions is then done by creating a collection of Context, Container, Component and (optionally) Code (e.g. UML class) diagrams. This is where the C4 model gets its name from.
Level 1: System Context diagram
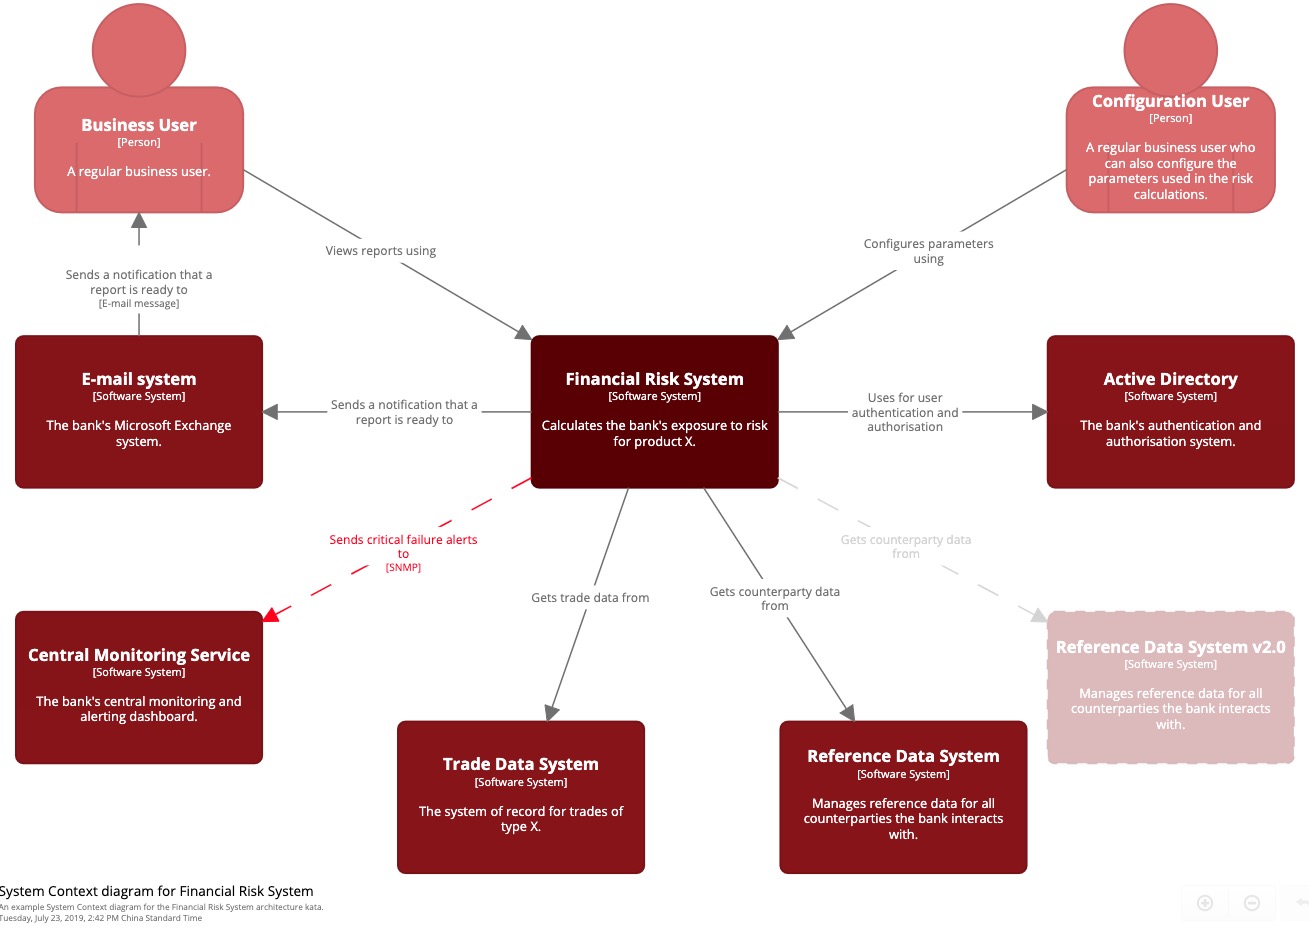
系统上下文图是用于绘制和记录软件系统的一个很好的起点,使您可以退后一步,查看全局。绘制一个图表,将您的系统显示为一个中心的方框,周围是用户和与之交互的其他系统。
A System Context diagram is a good starting point for diagramming and documenting a software system, allowing you to step back and see the big picture. Draw a diagram showing your system as a box in the centre, surrounded by its users and the other systems that it interacts with.
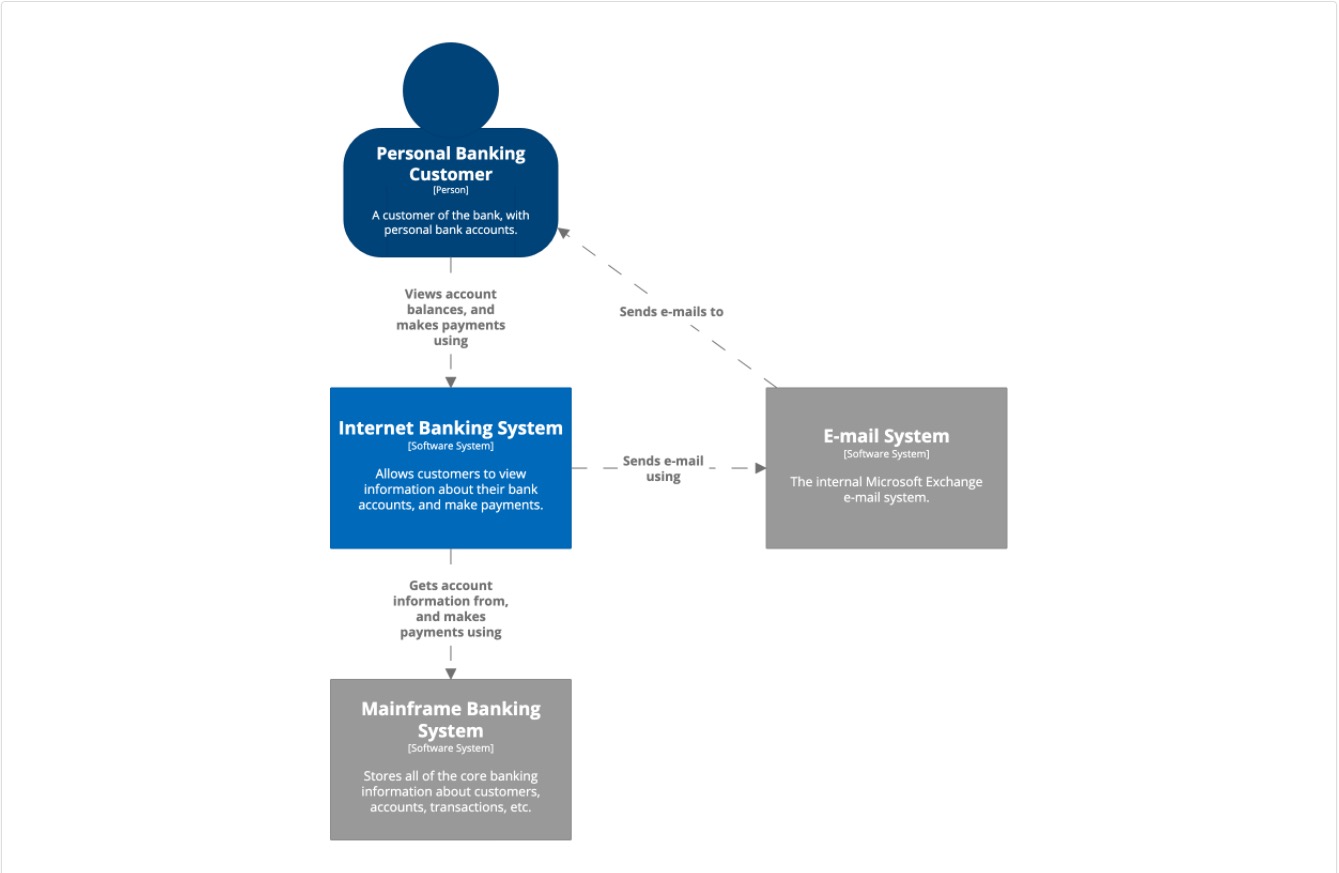
颜色编码已用于指示已经存在的软件系统(灰色框),虚线代表企业边界

Level 2: Container diagram
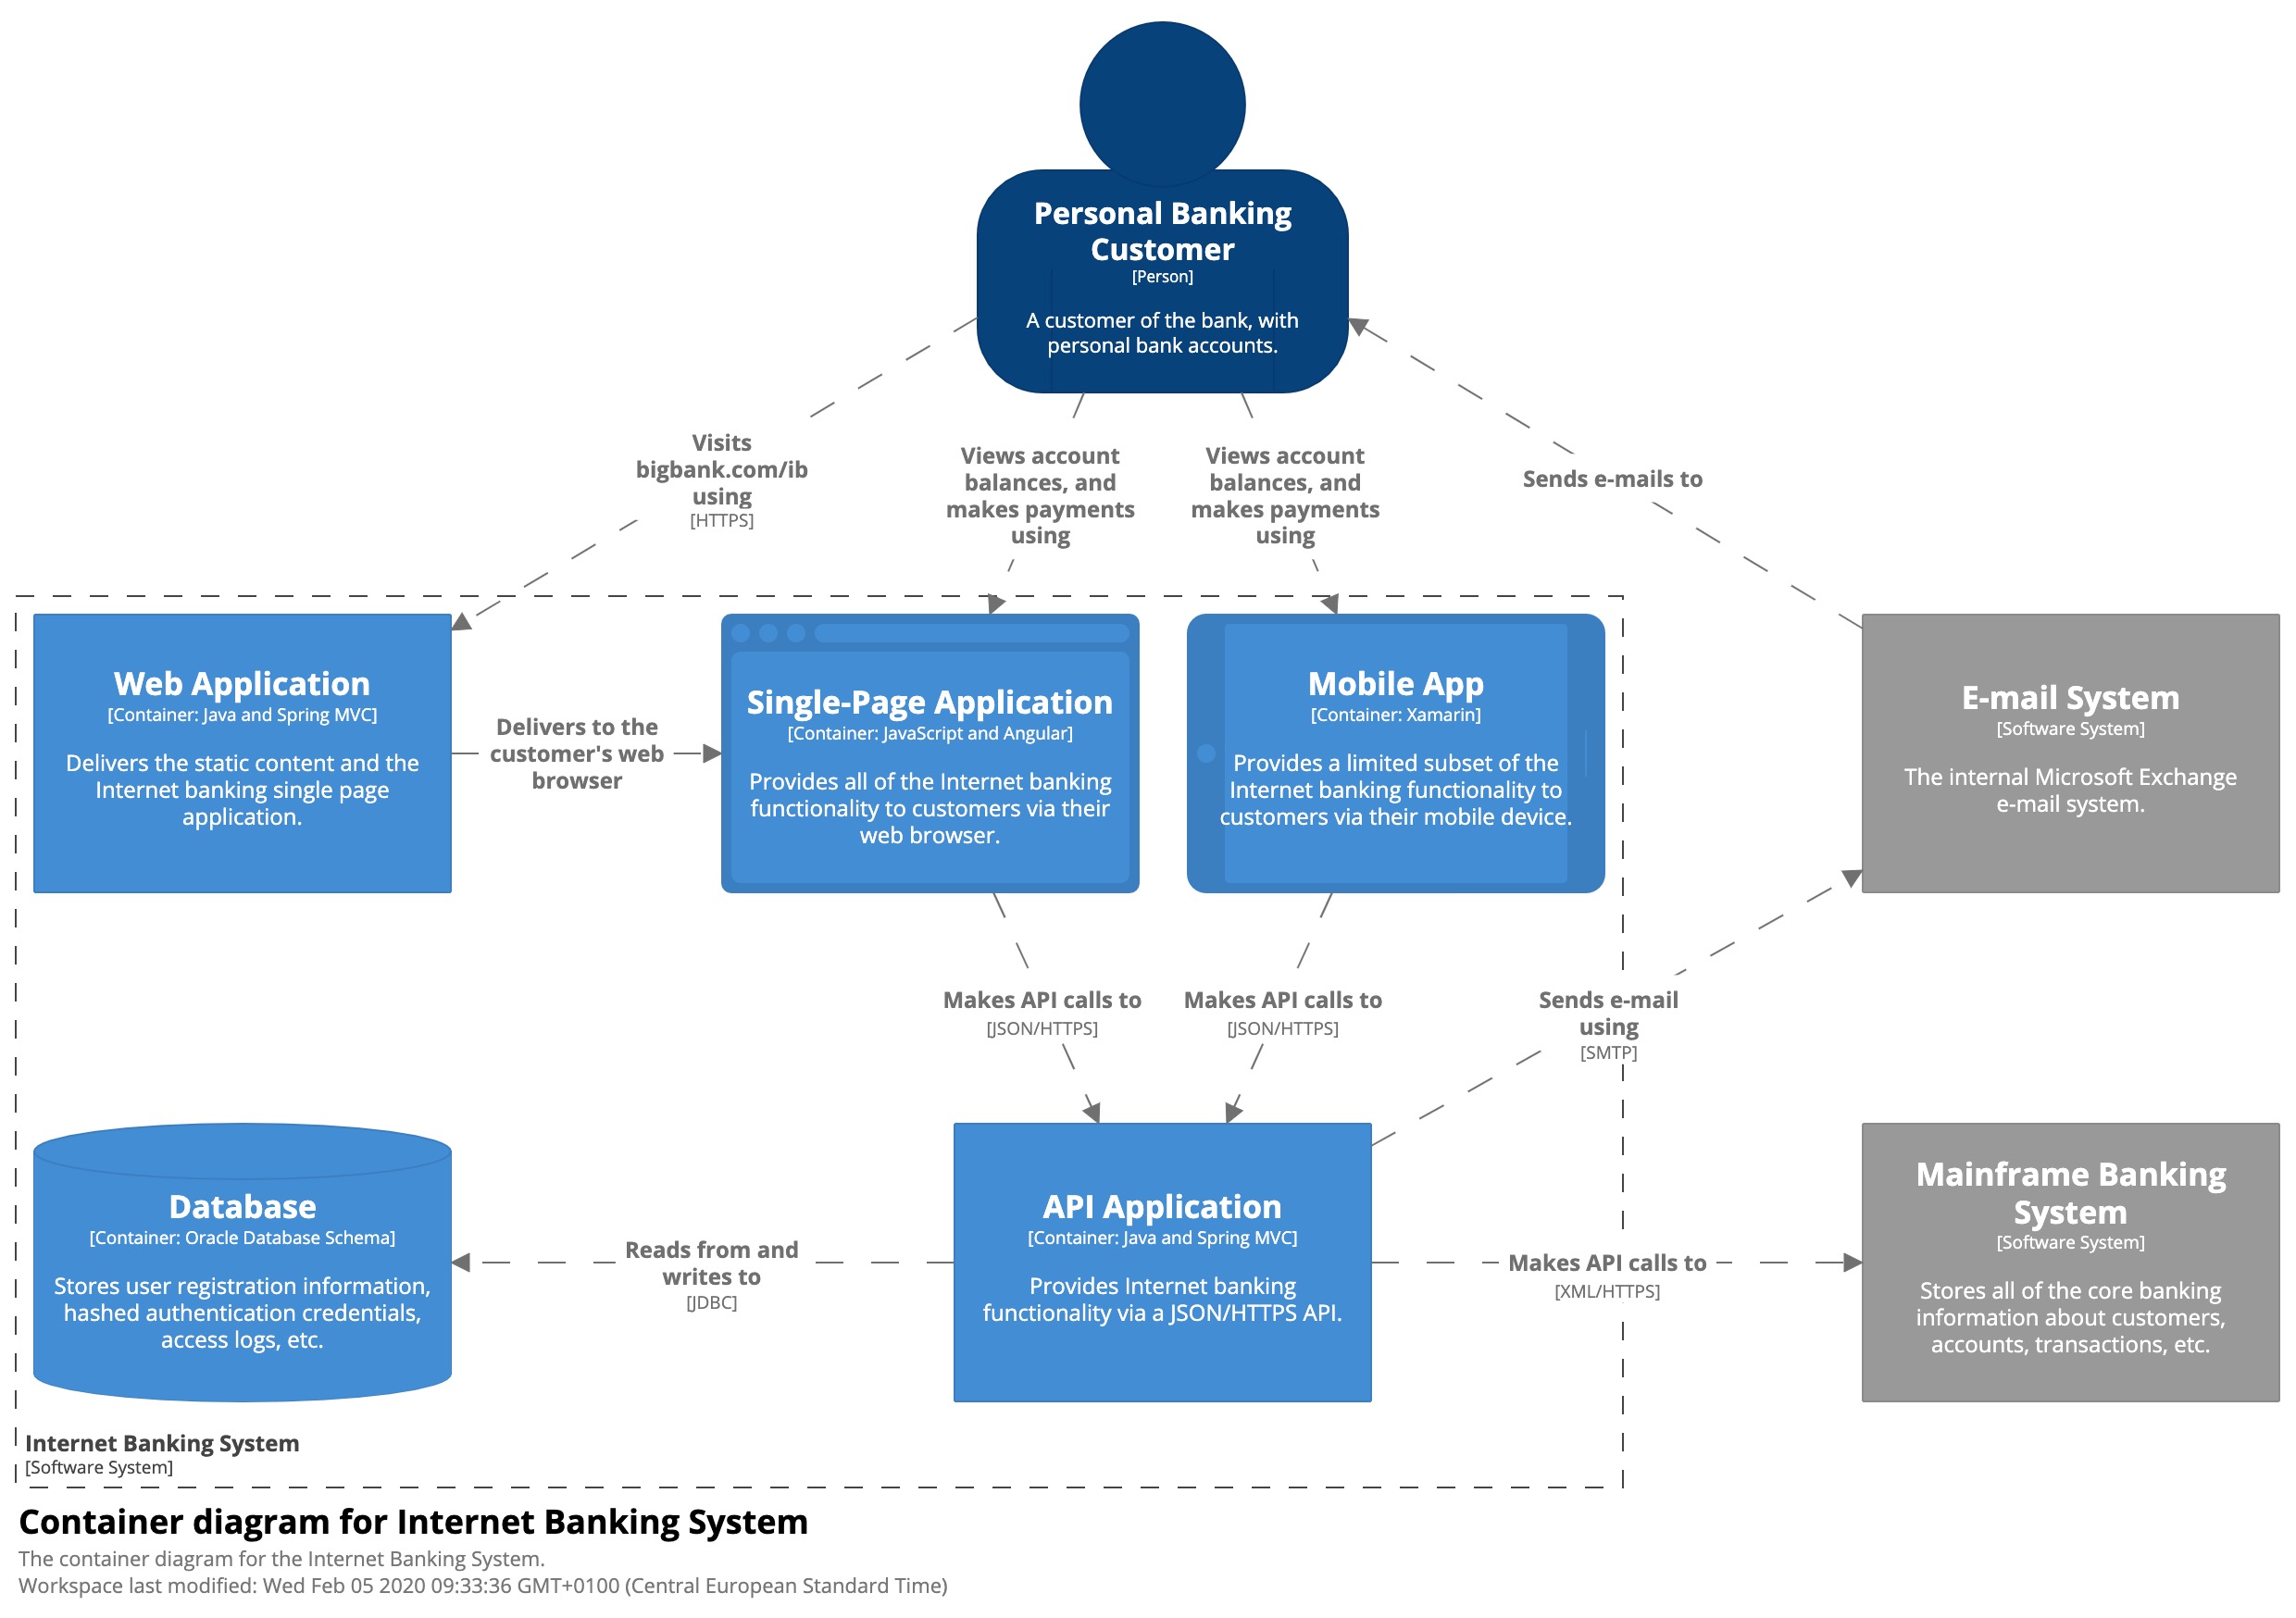
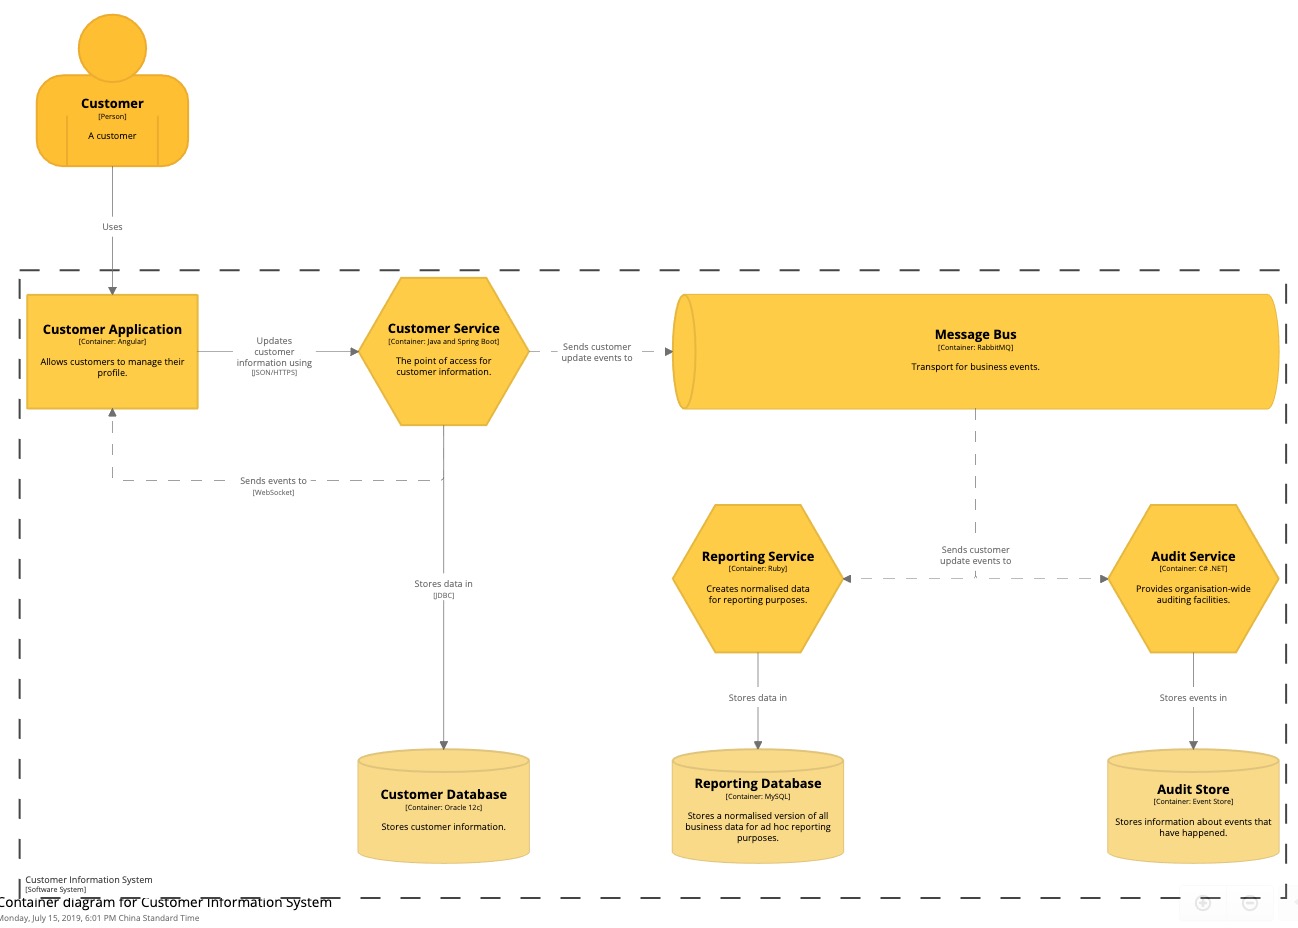
一旦了解了系统如何适应整个IT环境,接下来的一个非常有用的步骤就是使用容器图放大系统边界。“容器”类似于服务器端Web应用程序,单页应用程序,桌面应用程序,移动应用程序,数据库架构,文件系统等。本质上,容器是可单独运行/可部署的单元(例如,单独的进程空间) )执行代码或存储数据。
Once you understand how your system fits in to the overall IT environment, a really useful next step is to zoom-in to the system boundary with a Container diagram. A “container” is something like a server-side web application, single-page application, desktop application, mobile app, database schema, file system, etc. Essentially, a container is a separately runnable/deployable unit (e.g. a separate process space) that executes code or stores data.
容器图显示了软件体系结构的高层结构以及如何在其间分配职责。它还显示了主要的技术选择以及容器之间的通信方式。这是一个简单的,专注于技术的高级图表,对软件开发人员和支持/运营人员均非常有用。
The Container diagram shows the high-level shape of the software architecture and how responsibilities are distributed across it. It also shows the major technology choices and how the containers communicate with one another. It’s a simple, high-level technology focussed diagram that is useful for software developers and support/operations staff alike.
Level 3: Component diagram
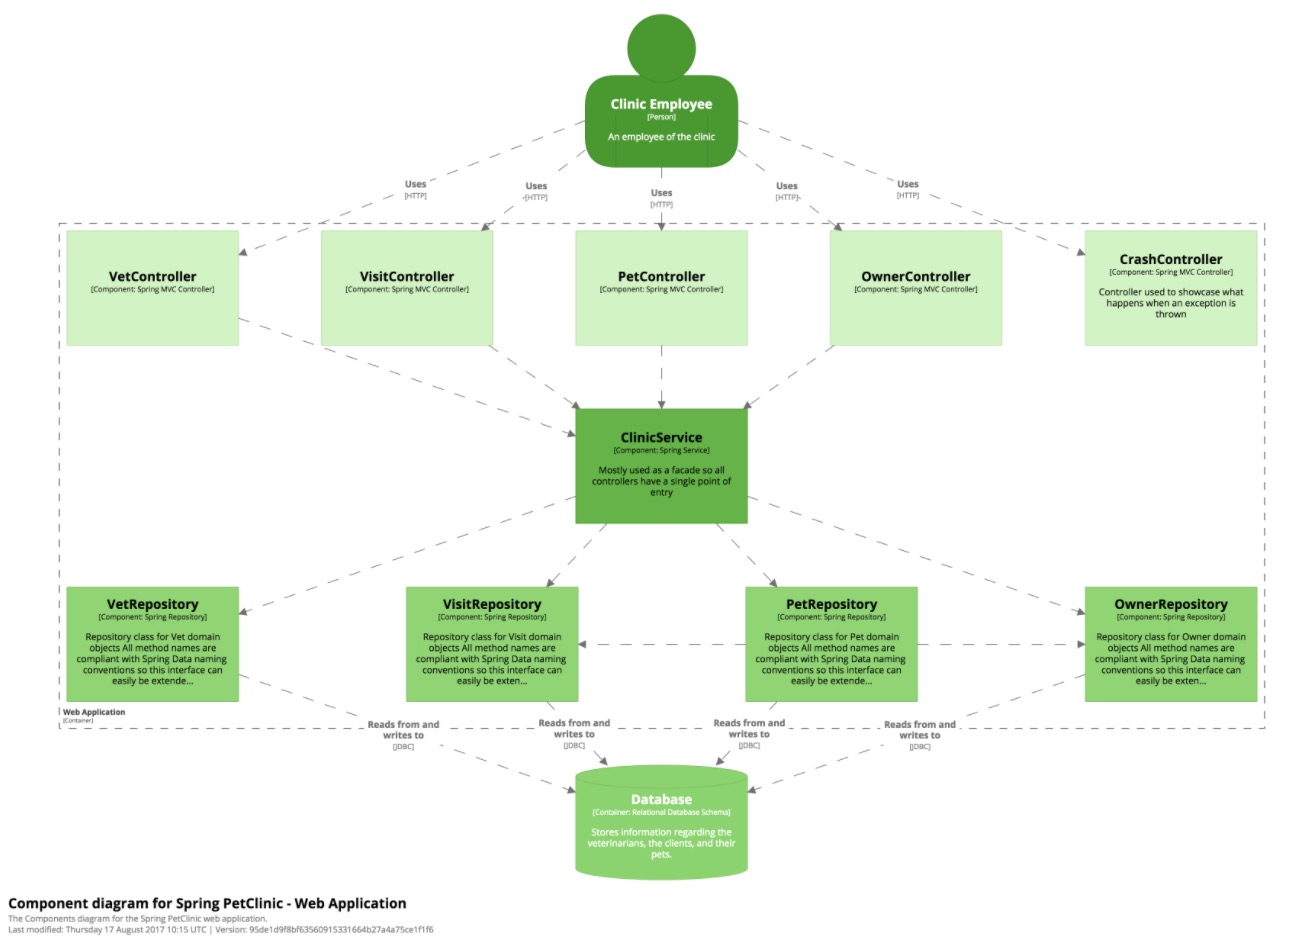
接下来,您可以放大并进一步分解每个容器,以识别主要的结构构件及其相互作用。
组件图显示了容器是如何由多个“组件”组成的,这些组件分别是什么,它们的职责以及技术/实现细节。
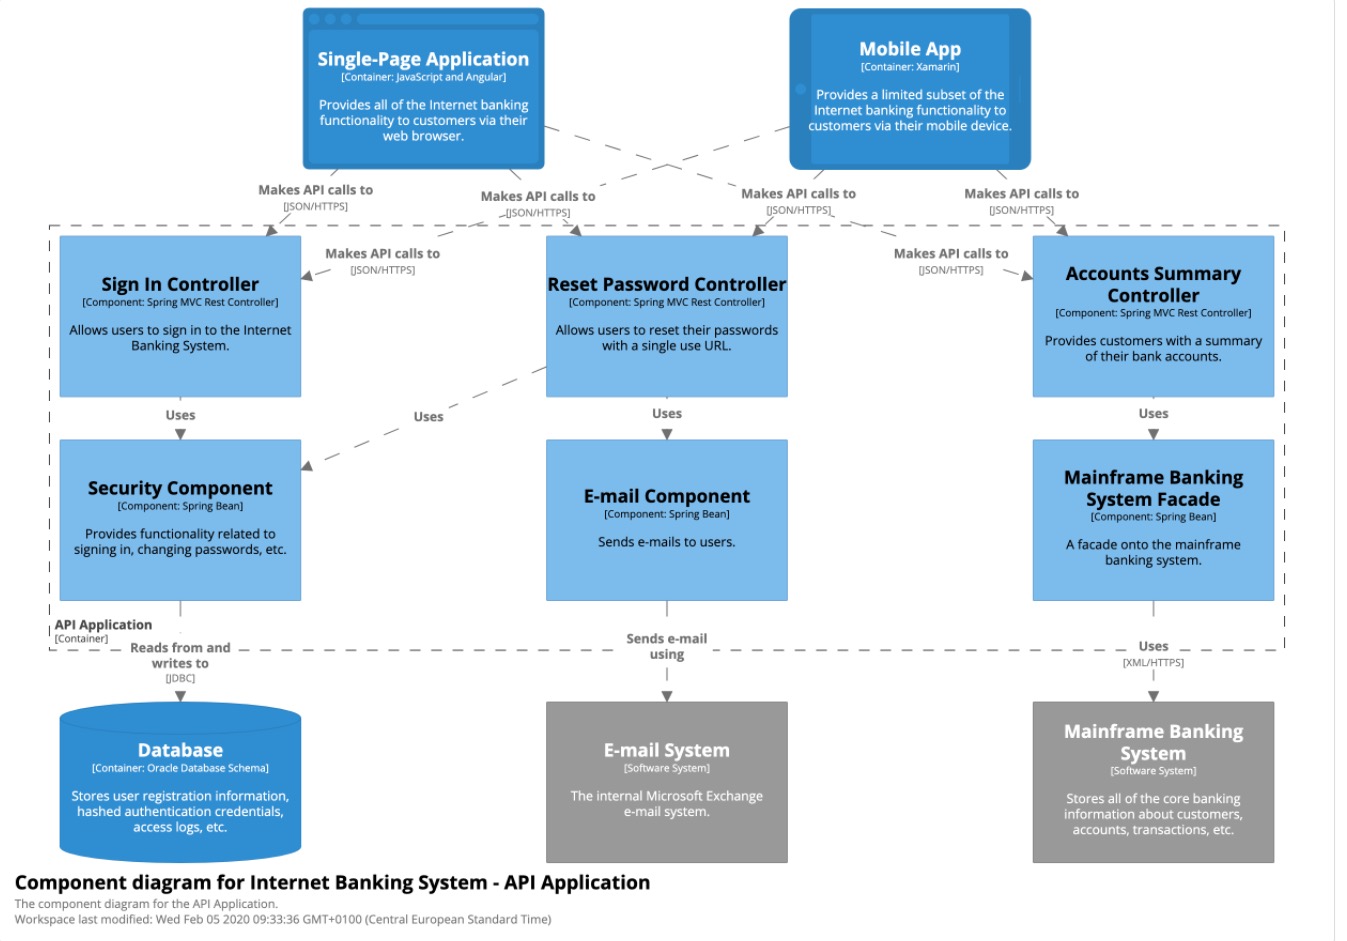
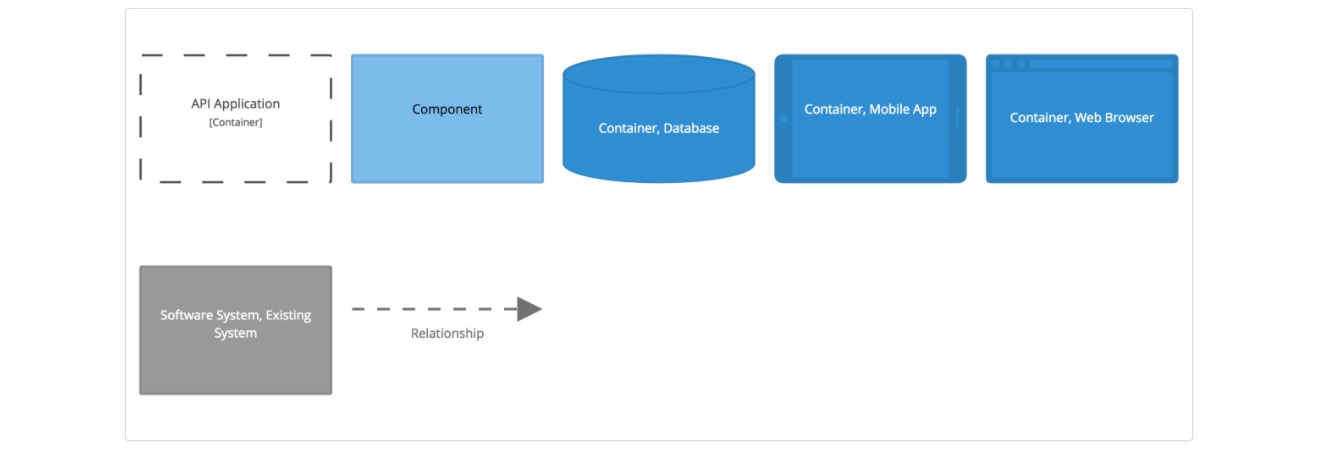
虚线表示API应用程序的边界,显示了其中的组件(浅蓝色)
Level 4: Code (不建议使用)
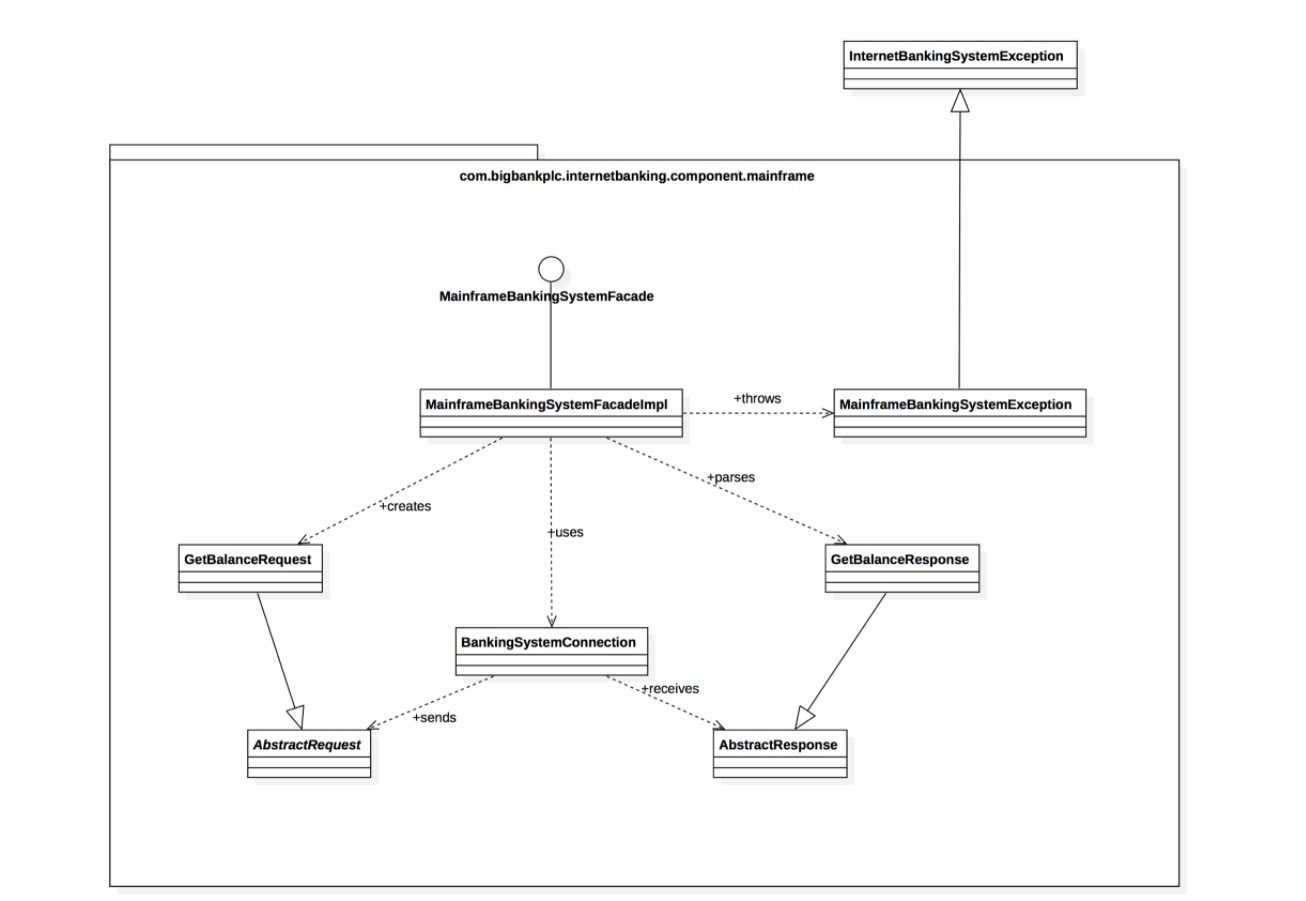
最后,您可以放大每个组件以显示如何将其实现为代码。使用UML类图,实体关系图或类似的图。
Finally, you can zoom in to each component to show how it is implemented as code; using UML class diagrams, entity relationship diagrams or similar.
这是可选的详细级别,通常可以从IDE等工具中按需获得。理想情况下,此图将使用工具(例如,IDE或UML建模工具)自动生成,并且您应该考虑仅显示那些允许您讲述自己想要讲述的故事的属性和方法。除了最重要或最复杂的组件外,不建议使用此级别的细节。
This is an optional level of detail and is often available on-demand from tooling such as IDEs. Ideally this diagram would be automatically generated using tooling (e.g. an IDE or UML modelling tool), and you should consider showing only those attributes and methods that allow you to tell the story that you want to tell. This level of detail is not recommended for anything but the most important or complex components.
补充图(Supplementary diagrams)
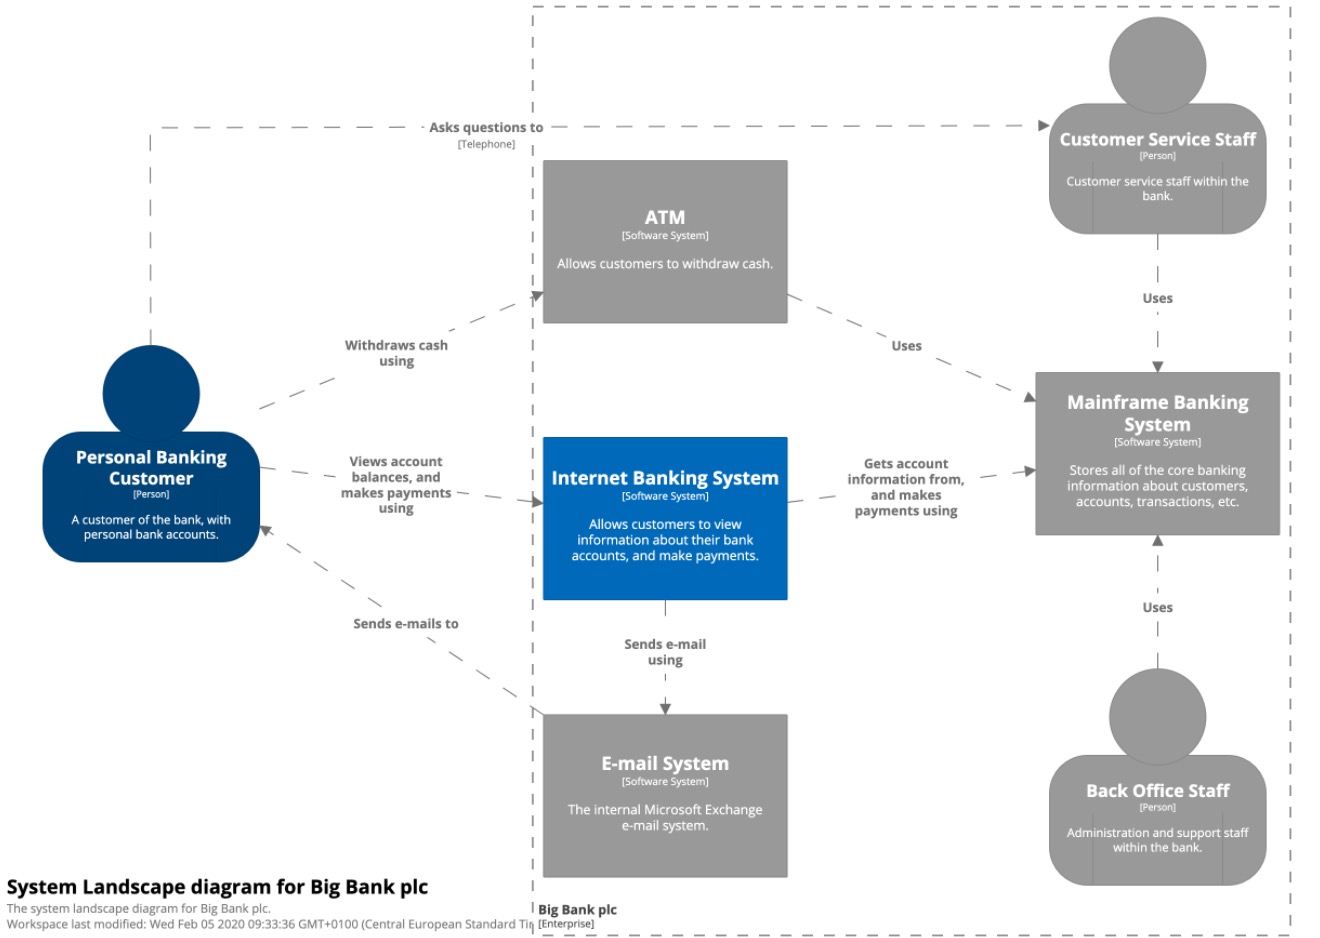
系统全景图(System Landscape diagram)
C4模型提供单个软件系统的静态视图,但是在现实世界中,软件系统永远不会孤立存在。因此,尤其是在您负责一组软件系统时,了解所有这些软件系统如何在企业范围内融合在一起通常很有用。为此,只需添加另一个C4图顶部的图,以从IT角度显示系统格局。像系统上下文图一样,该图可以显示组织边界,内部/外部用户和内部/外部系统。
The C4 model provides a static view of a single software system but, in the real-world, software systems never live in isolation. For this reason, and particularly if you are responsible for a collection of software systems, it’s often useful to understand how all of these software systems fit together within the bounds of an enterprise. To do this, simply add another diagram that sits “on top” of the C4 diagrams, to show the system landscape from an IT perspective. Like the System Context diagram, this diagram can show the organisational boundary, internal/external users and internal/external systems.
本质上,这是企业级软件系统的高级映射,其中每个感兴趣的软件系统都有C4向下钻取。从实践的角度来看,系统格局图实际上只是系统上下文图,而没有特别关注特定的软件系统。
Essentially this is a high-level map of the software systems at the enterprise level, with a C4 drill-down for each software system of interest. From a practical perspective, a system landscape diagram is really just a system context diagram without a specific focus on a particular software system.
动态图(Dynamic diagram)
当您想显示静态模型中的元素如何在运行时进行协作以实现用户故事,用例,功能等时,动态图可能会很有用。该动态图基于UML通讯图 (以前称为“ UML”协作图”)。它类似于UML序列图, 但是它允许带有编号的交互作用的图元素的自由形式排列以指示顺序。
A dynamic diagram can be useful when you want to show how elements in a static model collaborate at runtime to implement a user story, use case, feature, etc. This dynamic diagram is based upon a UML communication diagram (previously known as a “UML collaboration diagram”). It is similar to a UML sequence diagram although it allows a free-form arrangement of diagram elements with numbered interactions to indicate ordering.
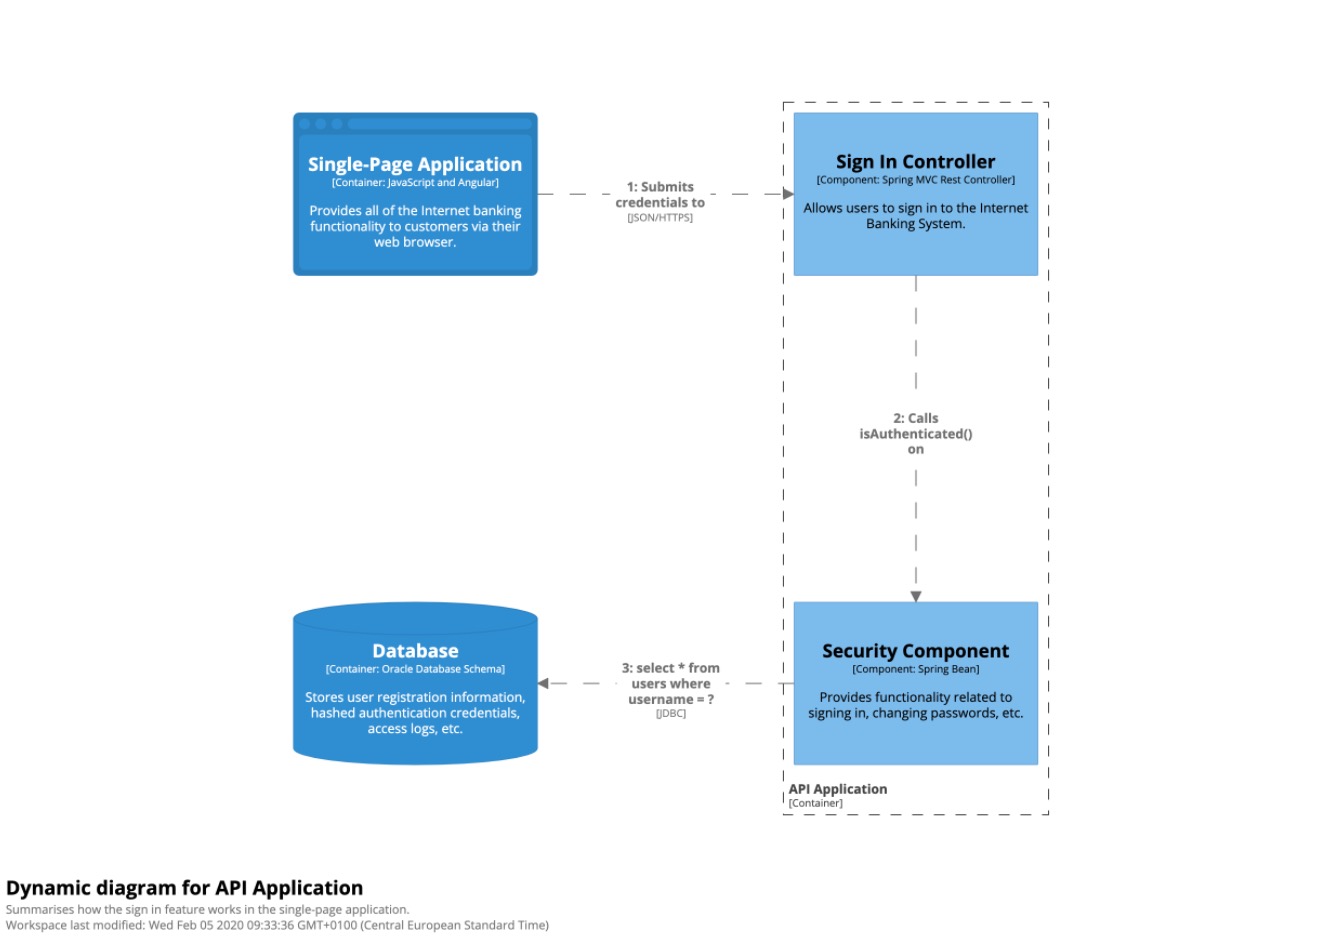
动态图 ≈ 通信图 + 时序图
部署图(Deployment diagram)
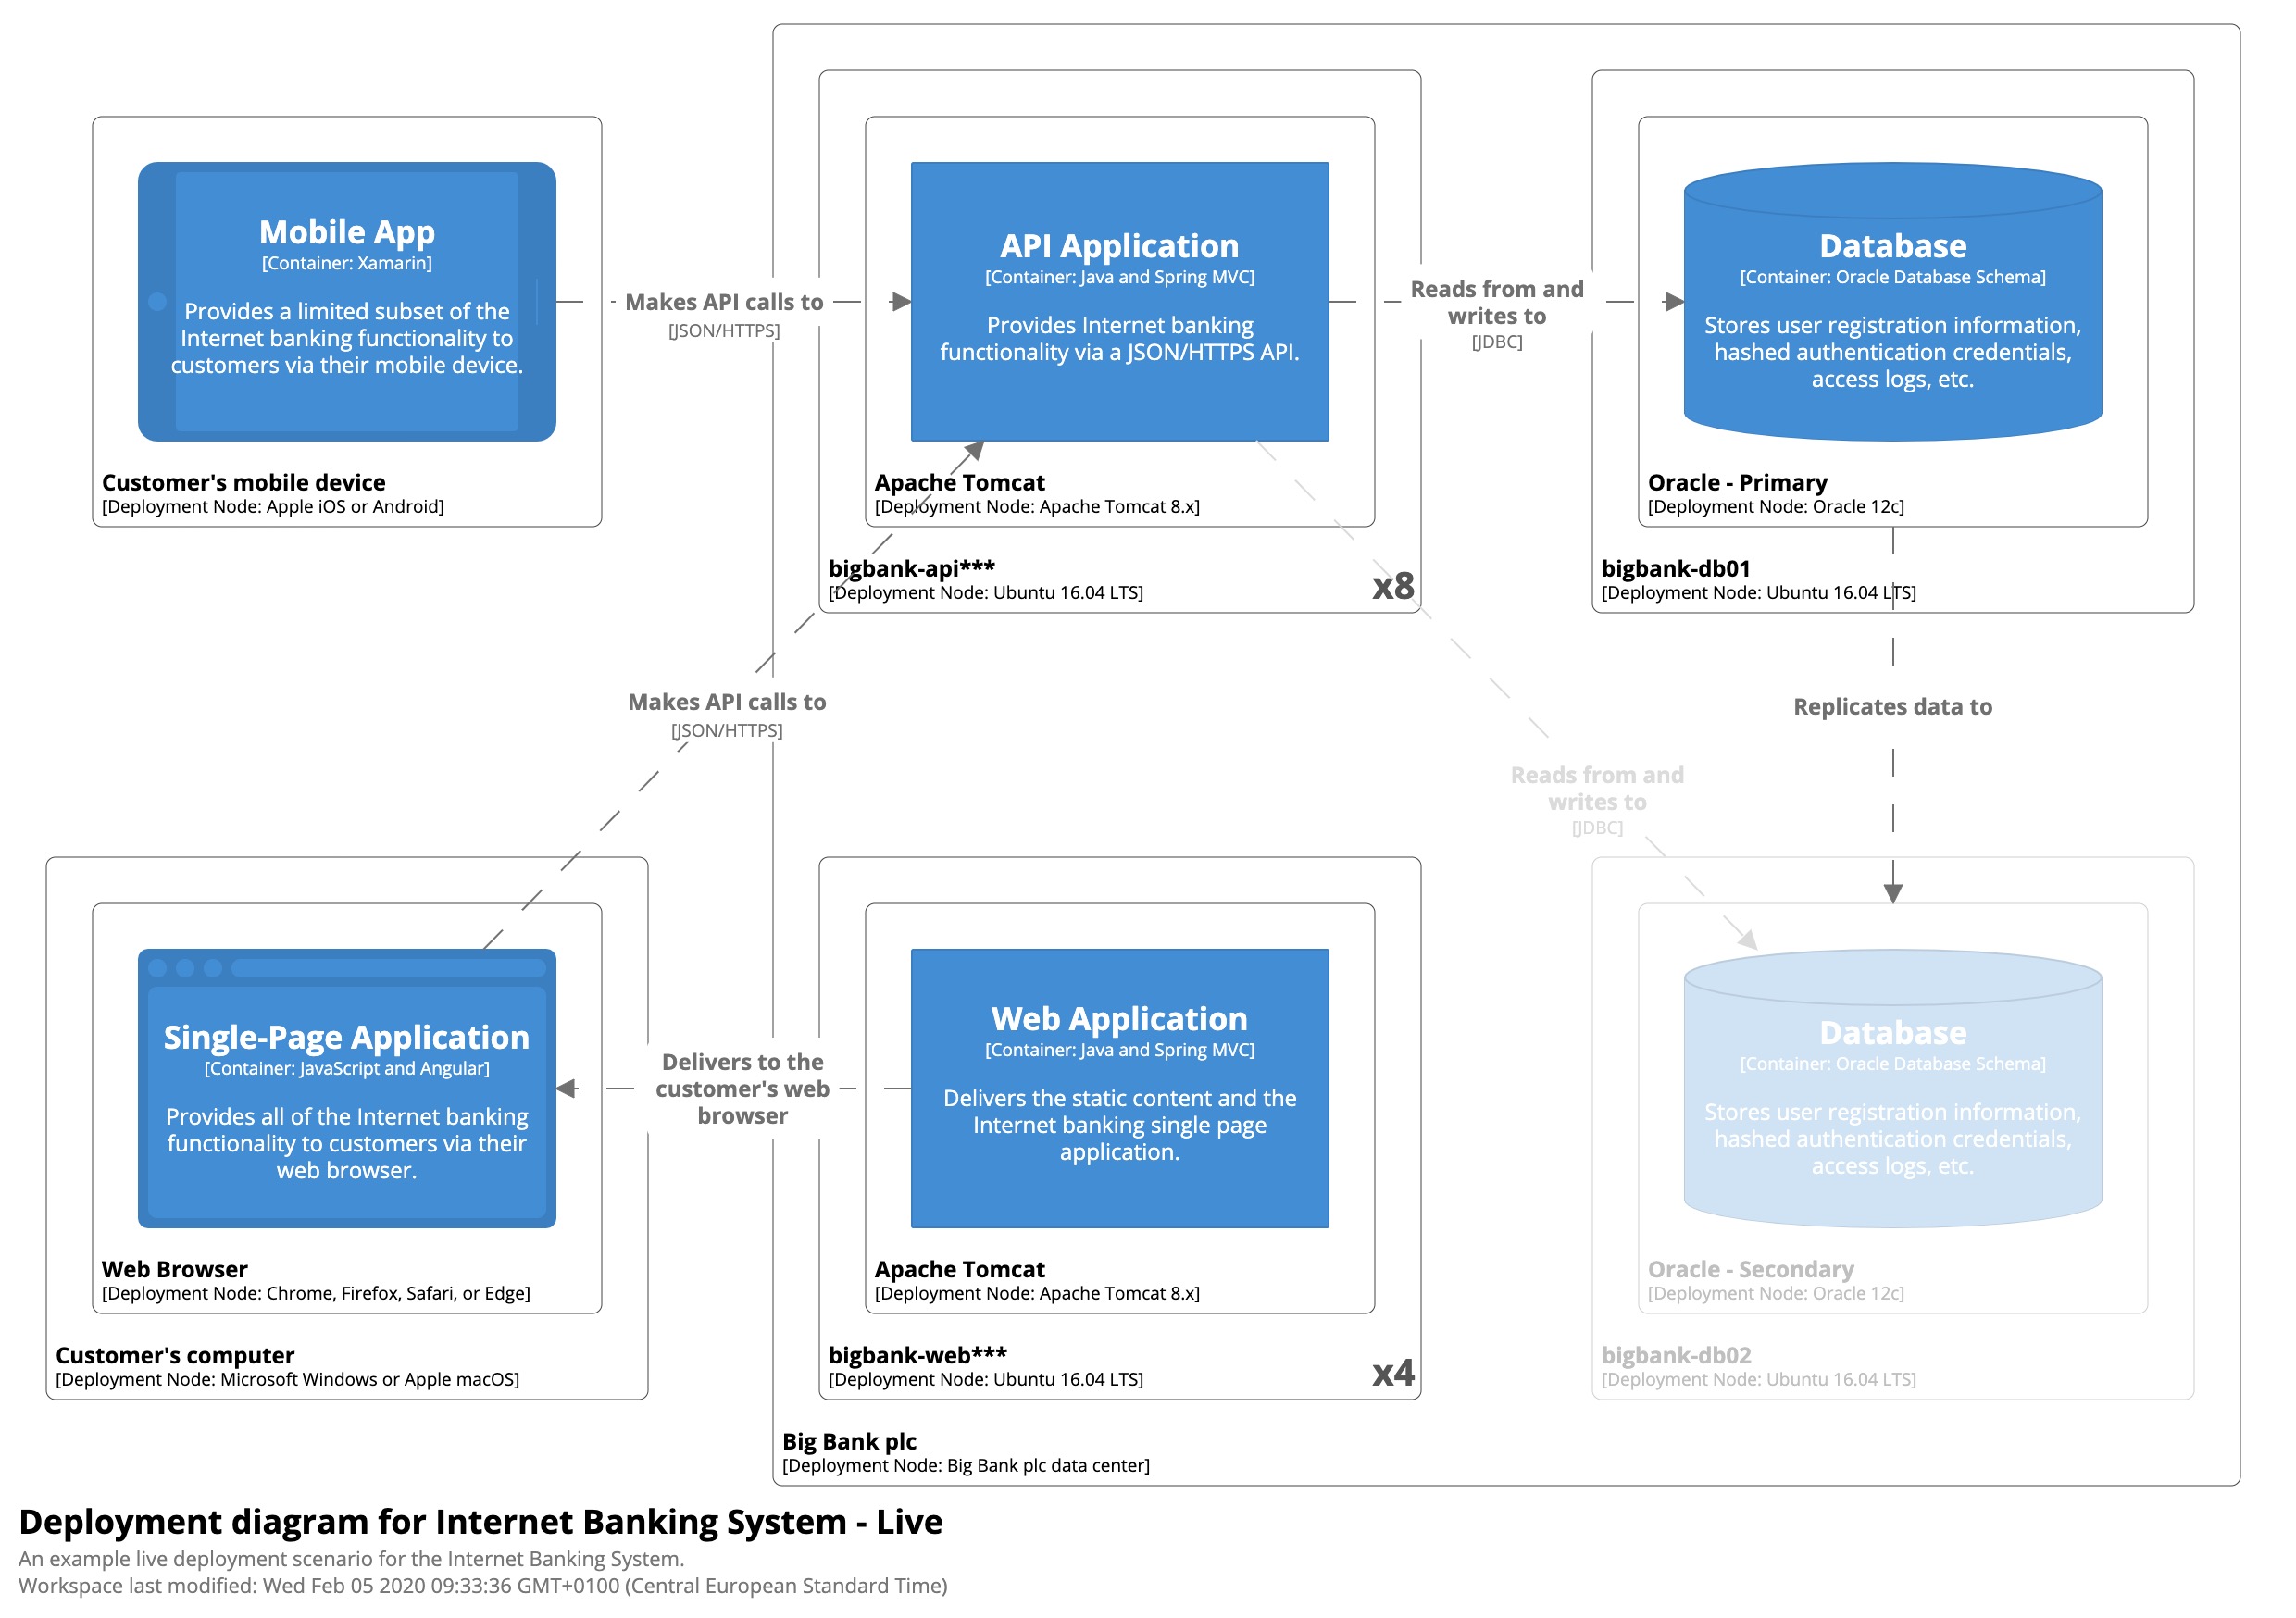
部署图使您能够说明静态模型中的容器如何映射到基础结构。该部署图基于UML部署图,尽管略微简化以显示容器和部署节点之间的映射。部署节点类似于物理基础架构(例如物理服务器或设备),虚拟化基础架构(例如IaaS,PaaS,虚拟机),容器化基础架构(例如Docker容器),执行环境(例如数据库服务器,Java EE) Web /应用程序服务器,Microsoft IIS)等。部署节点可以嵌套。
A deployment diagram allows you to illustrate how containers in the static model are mapped to infrastructure. This deployment diagram is based upon a UML deployment diagram, although simplified slightly to show the mapping between containers and deployment nodes. A deployment node is something like physical infrastructure (e.g. a physical server or device), virtualised infrastructure (e.g. IaaS, PaaS, a virtual machine), containerised infrastructure (e.g. a Docker container), an execution environment (e.g. a database server, Java EE web/application server, Microsoft IIS), etc. Deployment nodes can be nested.
您可能还希望包括基础结构节点,例如DNS服务,负载平衡器,防火墙等。
符号
C4模型没有规定任何特定的符号。以下是一种适用于白板,纸张,便签,索引卡和各种绘图工具的简单表示法

C4 != UML
尽管上面的示例图是使用“框和线”符号创建的,但是可以使用UML并适当使用包,组件和构造型来说明核心图。但是,最终的UML图确实缺少相同程度的描述性文本,因为使用某些UML工具无法(或不容易)添加此类文本。然后作者推荐了一个建模工具……(此处忽略)
示例
来源: https://structurizr.com/share/1#components
System Context diagram
Container diagram
Component diagram
